

Open Free Demat and Trading Acccount in Upstox
http://upstox.com/open-account/?f=HBRR
The morning star pattern is considered as a bullish reversal pattern, it often occurs at the bottom of a downtrend and it consists of three candlesticks:
- The first candlestick is a bearish or Red Candle which indicates that sellers are still in charge of the market.
- The second candle is a small one which represents that sellers are in control, but they don’t push the market much lower and this candle can be bullish or bearish
I.e. Short green or Red candle.
- The third candle is a bullish or Green candlestick that gapped up on the openand closed above the midpoint of the body of the first day, thiscandlestick holds a significant trend reversal signal.
This is how professional traders analyze the market based on candlestick patterns, and this is how you will analyze financial markets.

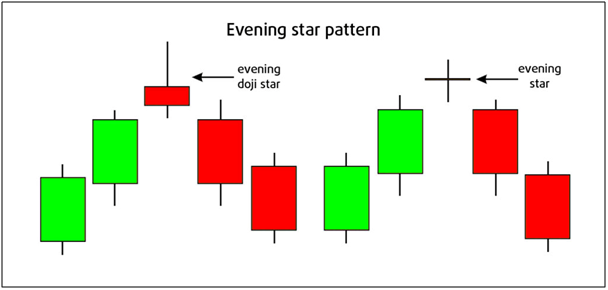
The Evening Star Pattern
The evening star pattern is considered as a bearish reversal pattern that usually occurs at the top of an uptrend.
The pattern consists of three candlesticks:
- The first candle is a bullish or Green candle
- The second candle is a small candlestick, it can be bullish or bearish or it can be a Doji.
- The third candle is a large bearish or Red candle.
In general, the evening star pattern is the bearish version of the morning star pattern.
The market was trending up, the first candle in the pattern indicates a long move up. The second one is a short candle indicating price consolidation and indecision. The third one is ready for a bearish move.
The trend that created the first long bullish candlestick is losing momentum. The final candlestick gaping lower than the previous candlestick indicating confirmation of the reversal and the beginning of a new trend down.
The Hammer (pin bar)
The Hammer candlestick is created when the open high and close are roughly the same price; it is also characterized by a long lower shadow that indicates a bullish rejection from buyers and their intention to push the market higher.
The formation of thehammer (pin bar) is a significant reversal pattern.The long shadow represents the high buying pressure from this point.
- Sellers were trying to push the market lower, but at that level, the buying power was more powerful than the selling pressure which results in a trend reversal.

The Shooting Star (Bearish Pin Bar)
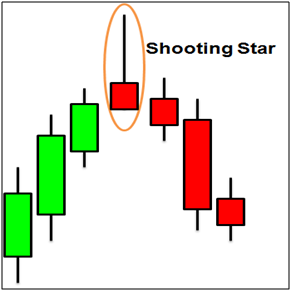
The shooting formation is formed when the open low, and close are roughly the same price, this candle is characterized by a small body and a long upper shadow. It is the bearish version of the hammer. Professional technicians say that the shadow should be twice the length of the real body.
- he formation of this pattern indicates the end of the uptrend move and the beginning of a new downtrend.
- This candlestick pattern can be used with support and resistance, supply and demand areas, and technical indicators.
- The shooting star is very easy to identify, and it is very profitable, it is one of the most powerful signals which most traders’ use.
The Harami Pattern (The Inside Bar)

The Harami pattern (pregnant in Japanese) is considered as a reversal
and continuation pattern, and it consists of two candlesticks:
- The first candle is the large candle, it is called the mother candle.
- The second candle is a smaller candle which is called the baby.
For the Harami pattern to be valid, the second candle should close outside the previous one.
This candlestick is considered as a bearish reversal signal when it occurs at the top of an uptrend, and it is a bullish signal when it occurs at the bottom of a downtrend.

The Tweezers tops and bottoms
The tweezers top formation is considered as a bearish reversal patternseen at the top of an uptrend, and the tweezers bottom formation isinterpreted as a bullish reversal pattern seen at the bottom of adowntrend.
Tweezers Top:
The tweezers top formation consists of two candlesticks,the first one is a bullish candlestick followed by a bearish candlestick at a Top of an uptrend, which signifies the reversal of the uptrend. This can be effective with a combination of Technical Indicators.

Tweezers Bottom:
The tweezers Bottom formation consists of two candlesticks,the first one is a Bearish candlestick followed by a Bullish candlestick at a bottom of adowntrend, which signifies the reversal of the downtrend. This can be effective with a combination of Technical Indicators.

Disclaimer – This posts is only for education and learning purposes. Our Websites is not responsible for your profit and loss. Please consult your financial Advisor before investing.
Leave a Reply