What is Bollinger Bands
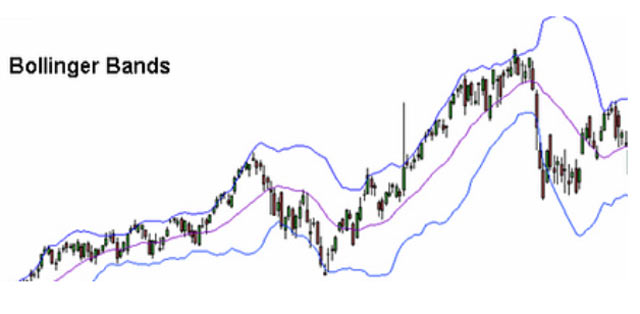
Bollinger Bands is a technique to use the moving average with two bands. In two bands one is an upper band and another is a lower band.
In this band, a standard deviation will be available in between the upper band and lower band. Standard deviation is a formula that denotes the market volatility.
In that, it shows us how the market will vary from its value. Bollinger band will adjust accordingly with stock price movement.
A trader can find all the data of price in between of upper band and lower band. In general views, Bollinger band consist of three lines first is upper band, second is a signal line or centre line and third is a lower band. The stock price will move generally in that two bands only.
The exponential moving average is the centre line. Bollinger bands will expand as per the price action and with volatility or contraction when less volatility when stock price in a tight range.
Stock will always follow a trend with volatility from time to time. Trader or investor will use it for price action.
How Bollinger Bands works
Important Point in Bollinger Bands
- When a stock price is going to touch the upper band of Bollinger band, it means to share in the overbought zone. On that time trader or investor always sell the share.
- When a stock price is going to touch the lower band of Bollinger band, it means to share in the oversold zone. On that time trader or investor always buy the share.

Leave a Reply