

A candlestick is a type of price chart used in technical analysis that displays the high, low, open, and closing prices of a security for a specific period. It originated from Japanese rice merchants and traders to track market prices and daily momentum hundreds of years before becoming popularized in the United States
Bullish and Bearish Candle
If the closing price is above the open price, we can say that the candlestick is bullish which means that the market is rising in this period. Bullish candlesticks are always displayed as Green candlestick. Most trading platforms use Green color to refer to bullish candlesticks.
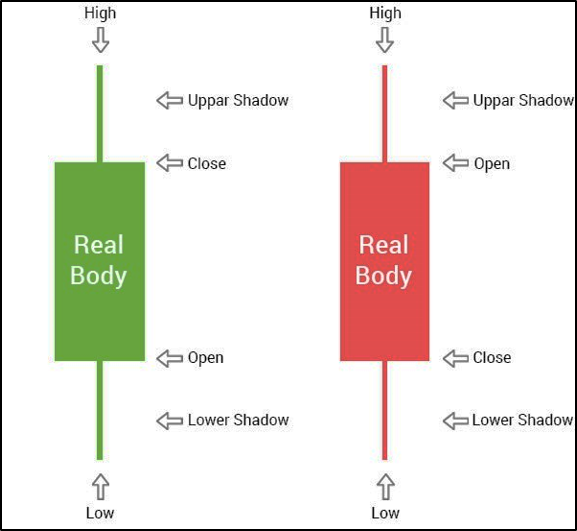
If the closing price is below the open price, we can say that the candlestick is bearish which indicates that the market is falling in this session. Bearish candles are commonly displayed as Red candles.
You can find different colors used to differentiate between bullish and bearish candlesticks.
- The filled part of the candlestick is called the real body.
- The thin lines poking above and below the body are called shadows.
- The top of the upper shadow is the high
- The bottom of the lower shadow is low.
Candlestick Body Sizes

Long bodies refer to strong buying or selling pressure,
- If there is a Green candlestick with a long body, this indicates that buyers are stronger and they are taking control of the market during this period.
- If there is a bearish candlestick with a long body, this means that the selling pressure controls the market during this chosen time frame.
Short or small bodies indicate less buying or selling pressure.
Candlestick Shadows (tails):
The upper and lower shadows give us important information about the trading session.
- Upper shadows signify the session high.
- Lower shadows signify the session low.
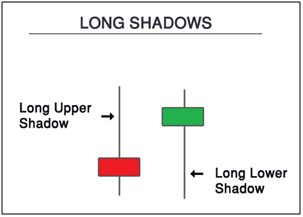
- The Long Upper shadow with a short body signifies that there is more seller pressure during the period.
- Long Lower shadow with short body signify that there is more buyer pressure during the period.
The Engulfing Bar Candlestick Pattern
There are 2 Types of Engulfing bar candlestick patterns.
- Bullish Engulfing
- Bearish Engulfing
Bullish Engulfing Bar consists of two candlesticks, the first one is the small body, and the second is the engulfing green candle.

The bullish engulfing bar pattern tells us that the market is no longer under the control of sellers, and buyers will take control of the market.
- When a bullish engulfing candle forms in the context of an uptrend, it indicates a continuation signal.
- When a bullish engulfing candle forms at the end of a downtrend, the reversal is much more powerful.
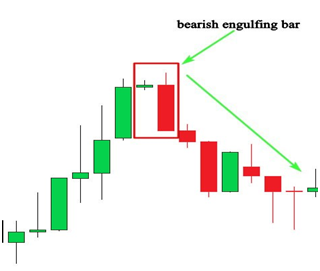
Example:


The example above shows us clearly how the market continues with the trend along with bullish engulfing and also how it changes direction after the formation of a bullish engulfing bar pattern.
The smaller body that represents the selling power was covered by the second body that represents the buying power to go bullish.
Bearish Engulfing Bar consists of two candlesticks, the first one is the small body, and the second is the engulfing Red candle.
This is how a bearish engulfing bar pattern looks like on your charts,this candlestick pattern gives us valuable information about bulls andbears in the market.
When this pattern occurs at the end of an uptrend, this indicates thatbuyers are engulfed by sellers which signals a trend reversal.
when this price action pattern occurs in an uptrend, wecan anticipate a trend reversal because buyers are not still in controlof the market, and sellers are trying to push the market to go down.
You can’t trade any bearish candlestick pattern you find on your chart; you will need other technical tools to confirm your entries.
Leave a Reply